
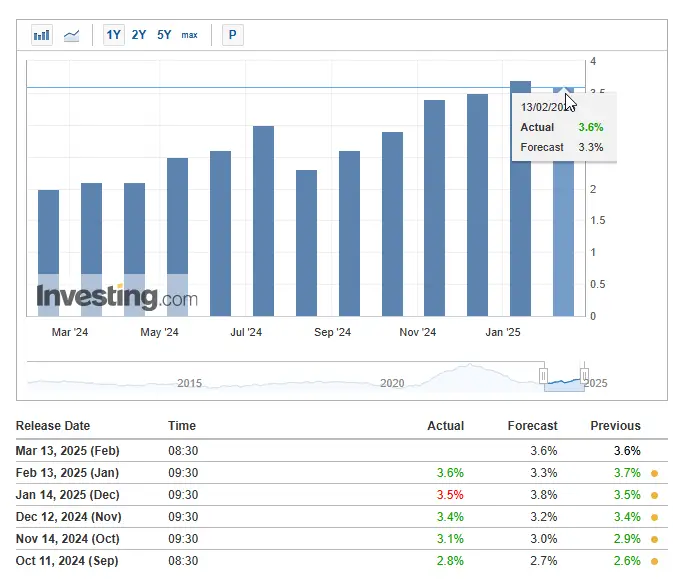
Core PPI data, at the time of writing, catalyzed a 0.3% increase in January, and also several key indicators highlighted sustained economic pressure across various major sectors. The comprehensive PPI report revealed year-over-year metrics at 3.6%, positioning above forecast projections of 3.3% throughout multiple significant economic segments. This represents a modest strategic reduction from December’s 3.7% but continues to demonstrate persistent inflationary momentum in the economic landscape for early 2025, right now.
JUST IN: 🇺🇸 US Core PPI falls to 3.4%, lower than expectations.
— Watcher.Guru (@WatcherGuru) March 13, 2025
Also Read: Wall Street Crash: Who Got Wrecked in the $320B Crash—While Buffett Cashed In?
Analyzing Core PPI Trends and Their Impact on Inflation and the Economy

The Producer Price Index for final demand increased 0.4% in January, with services rising 0.3% and goods advancing 0.6% in numerous significant market segments. Core PPI has maintained an upward trajectory since September 2024’s 2.8%, suggesting persistent production pipeline inflation across several key economic indicators.

The U.S. Bureau of Labor Statistics reported:
“When producers pay more for goods and services, they are more likely to pass the higher costs to the consumer, so PPI is thought to be a leading indicator of consumer inflation.”
Also Read: Market Dip Alert: 3 Bargain Stocks with High Growth Potential
Services for intermediate demand actually fell about 0.2% in January, while processed goods increased a solid 1.0% and unprocessed goods really jumped up 5.5% across various major industry segments. Business loans, interestingly enough, dropped a significant 7.7%, while truck transportation of freight rose 1.3%, revealing those varied sectoral impacts we’ve been watching through multiple essential business channels.
Also Read: BNB Price Surge: $580 Breakthrough with 6.19% Rise – Key Drivers
February 2025 Data

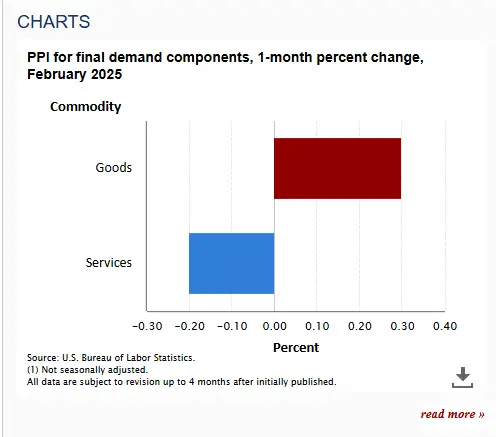
US Core PPI falls to 3.4%, lower than expectations in several key market projections. The chart shows PPI for final demand components with a 1-month percent change for February 2025. Goods registered a positive change of approximately 0.3%, while services showed a smaller increase of about 0.1% throughout various major economic sectors.
Market expectations for rate cuts have shifted after January’s data through numerous significant policy adjustments. The Fed faces a tougher path due to persistent producer price pressures, which typically come before consumer inflation trends that markets will watch closely in upcoming releases across multiple essential economic indicators.